Minitab v22.2

Minitab Overview
Harness the power of statistics. Data is everywhere, but are you truly taking advantage of yours? Minitab Statistical Software can look at current and past data to discover trends, find and predict patterns, uncover hidden relationships between variables, and create stunning visualizations to tackle even the most daunting challenges and opportunities. With powerful statistics, industry-leading data analytics, and dynamic visualizations on your side, the possibilities are endless.
Key Features of Minitab
- Discover
Regardless of statistical background, Minitab can empower all parts of an organization to predict better outcomes, design better products and improve processes to generate higher revenues and reduce costs. Only Minitab offers a unique, integrated approach by providing software and services that drive business excellence now from anywhere thanks to the cloud. Key statistical tests include t tests, one and two proportions, normality test, chi-square and equivalence tests. - Predict
Access modern data analysis and explore your data even further with our advanced analytics and open source integration. Skillfully predict, compare alternatives and forecast your business with ease using our revolutionary predictive analytics techniques. Use classical methods in Minitab Statistical Software, integrate with open-source languages R or Python, or boost your capabilities further with machine learning algorithms like Classification and Regression Trees (CART®) or TreeNet® and Random Forests®, now available in Minitab’s Predictive Analytics Module. - Achieve
Seeing is believing. Visualizations can help communicate your findings and achievements through correlograms, binned scatterplots, bubble plots, boxplots, dotplots, histograms, heatmaps, parallel plots, time series plots and more. Graphs seamlessly update as data changes and our cloud-enabled web app allows for secure analysis sharing with lightning speed. - Assistant
- Measurement systems analysis
- Capability analysis
- Graphical analysis
- Hypothesis tests
- Regression
- DOE
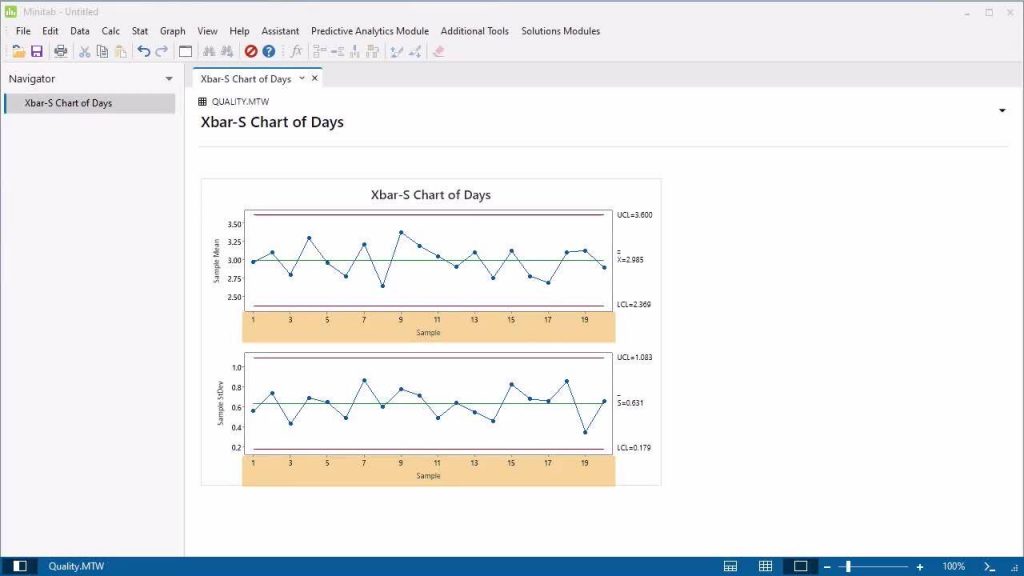
- Control charts
- Graphics
- Binned scatterplots*, boxplots, charts, correlograms*, dotplots, heatmaps*, histograms, matrix plots, parallel plots*, scatterplots, time series plots, etc.
- Contour and rotating 3D plots
- Probability and probability distribution plots
- Automatically update graphs as data change
- Brush graphs to explore points of interest
- Export: TIF, JPEG, PNG, BMP, GIF, EMF
- Basic Statistics
- Descriptive statistics
- One-sample Z-test, one- and two-sample t-tests, paired t-test
- One and two proportions tests
- One- and two-sample Poisson rate tests
- One and two variances tests
- Correlation and covariance
- Normality test
- Outlier test
- Poisson goodness-of-fit test
- Regression
- Linear regression
- Nonlinear regression
- Binary, ordinal and nominal logistic regression
- Stability studies
- Partial least squares
- Orthogonal regression
- Poisson regression
- Plots: residual, factorial, contour, surface, etc.
- Stepwise: p-value, AICc, and BIC selection criterion
- Best subsets
- Response prediction and optimization
- Validation for Regression and Binary Logistic Regression*
Minitab System Requirements
Below are the minimum system requirements for running the Minitab
| Processor: | Intel Pentium 4 or later. |
| RAM: | 2 GB available memory. |
| Windows: | 11, 10, 8.1/8, 7. |
| Space: | 600 MB available space. |
Minitab Changelog
Below is the list of changes made to the current version of Minitab.
Minitab Screenshots

How to use Minitab?
Follow the below instructions to activate your version of Minitab.
- Install software using given installer (in Setup folder)
- Close program if running (Even from system tray)
- Extract “Crack.zip” file and Copy its content to program’s installation folder
- That’s it, Enjoy!
Minitab Details
Below are the details about Minitab.
| App Size: | 293.2 MB |
| Setup Status: | Untouched |


